Income Inequality and Country Happiness

Summary
Based on widely used data on self-reported happiness, there is no strong relationship between country self-reported happiness and income inequality. There is, however, good evidence that a country’s views on income inequality are a cultural characteristic. Cultural norms are what ensure the cohesion of a societal group. So even if the data is correct and there is no systematic relationship between income inequality and happiness, views about income inequality can be important culturally.Country Happiness and Income Inequality
Figure 1 shows average country happiness (the two measures used -- WVS Life Satisfaction and the World Happiness Index Life Ladder -- are discussed in a prior post) versus income inequality as measured by the World Bank GINI Index. The GINI measure of income inequality ranges from 0 to 1 where 0 is the most income equality and 1 is the least income equality.
Figure 1: Country Happiness vs. Income Inequality


The first relationship would generally be considered weak but statistically significant (p-value < 0.05), while the second relationship with WHI Life Ladder is not statistically significant. In both cases the correlation relationships run in the “wrong direction” -- they indicate more income inequality is associated with more happiness.
While there is no apparent first order relationship between income inequality and happiness, what about income inequality’s impact on the happiness of those who classify themselves in the bottom 4 deciles of income? Perhaps average country happiness is masking greater unhappiness of those most disadvantaged by income inequality.
Figure 2: WVS Life Satisfaction of Bottom 4 Deciles of Self-reported Income Groups vs. GINI
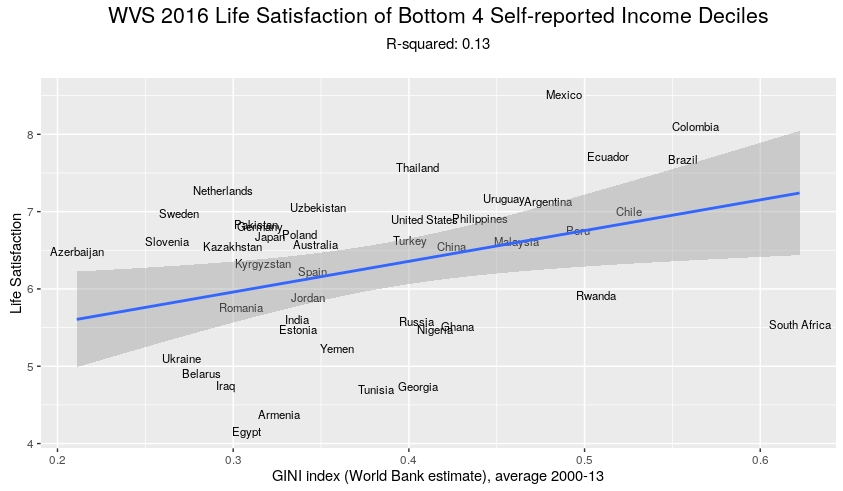
Here too as in the first chart in Figure 1 the relationship is weak, statistically significant, and running in the unexpected direction (more Life Satisfaction is associated with greater income inequality).
Perhaps the bottom income groups are not made less happy by higher income inequality, but maybe there is more happiness inequality in countries with high income inequality?
Figure 3: Standard Deviation of WVS Life Satisfaction vs. GINI

Once again, the relationship is weak, not statistically significant and running in the unexpected direction (more income inequality is associated with marginally less variance of Life Satisfaction).
As a final attempt, maybe snapshots in time are misleading --- perhaps we should be looking at changes in Life Satisfaction versus changes in income inequality? A country with high income inequality now, might have had even higher inequality in the past. So perhaps current happiness reflects an improvement relative to the past. Unfortunately the data set for this exercise is small because many countries do not have recorded GINI ratios over multiple years.
Figure 4: Changes in Life Satisfaction vs. Changes in GINI

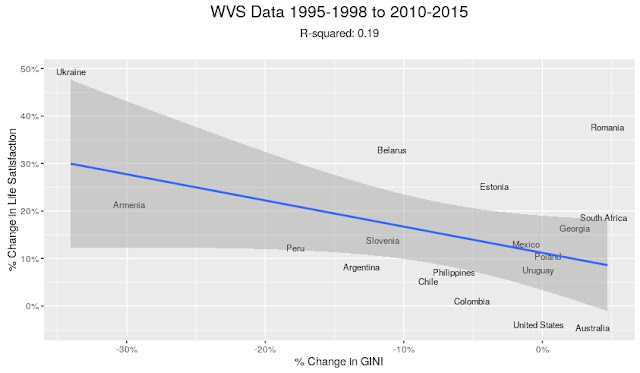

While Figure 4 looks encouraging for the expected relationship between decreasing income inequality and higher Life Satisfaction, neither chart relationship in Figure 4 is statistically significant. Intuitively one can see this if one considers -- that except for two data points (Armenia, Ukraine) -- the data points are more of a cluster than a line.
Not only is the relationship not statistically significant, both Armenia, the Ukraine, Belarus etc. had large increases in GDP/Capita over this time as shown in Figure 5. If you include that information in an equation along with change in GINI to predict Life Satisfaction change, the sign on the GINI coefficient once again flips in the unexpected direction (increasing inequality correlates with higher Life Satisfaction once you account for changes in income). In other words, increased income drove changes in happiness, not income inequality changes. Because none of the variables are statistically significant, once can’t conclude that with certainty. But again, it underscores there are no strong demonstrable connections between income inequality and country happiness.
Figure 5: Percent Changes in Life Satisfaction vs. Percent Changes in PPP GDP/Capita

Income Inequality As A Cultural Attitude
Why do income inequality GINI ratios vary so much around the world? The likely answer is culture. One of the hints that country culture is important can be seen from responses to a question the WVS asked regarding support for taxing the rich in order to subsidize the poor. Respondents gave answers on a 10 point scale with 1 meaning “taxing the rich to subsidize is not an essential characteristic of a democratic government” and 10 being “it is essential.” Figure 6 shows that country income inequality is higher in countries where a large proportion of the population believes subsidizing the poor is not an essential characteristic of democracy (and the relationship is statistically significant).
Figure 6: GINI ratio versus percent of respondents whose ratings fell in the most extreme 3 deciles asserting it is not an essential characteristic of democracy for the Government to tax the rich and subsidize the poor

Quite simply, if one's culture does not believe income inequality is important, one does not control for it and vice-versa.
Another hint that cultural attitudes about wealth and inequality are more important influences on country happiness than actual income inequality itself is seen in Figure 7. Countries are coded into 4 groups from least happy (red) to happiest (purple) based on their average Life Satisfaction score. They are then plotted against two axes which measure two beliefs measured by the WVS: (1) should the Government take more responsibility for people, or should people take more responsibility for themselves, and 2) can wealth grow so there is enough for everyone or can wealth grow only at the expense of others?
The happiest countries are clustered in the upper right --- believing that people should take responsibility for themselves and that one can become wealthier without hurting someone else. The least happy countries are clustered on the lower left -- believing that the Government should take more responsibility for people and that one can only become wealthy at the expense of others.
Figure 7: Country happiness groups mapped to attitudes towards the ethics of wealth and personal responsibility.

Culture is increasingly understood as major driver of value differences on a variety of issues including the importance of religion and the size and role of government. The World Value Survey researchers have done extensive work in this area and the culture maps and publications at their web site are worth reviewing.
Conclusion
Based on the available data to date, attitudes about income inequality affect Life Satisfaction as measured by the WVS; income inequality itself does not. Attitudes towards income inequality are one of many important facets that a people use to define themselves in order to achieve social cohesion. Cultural norms are not set in stone, however. The great deal of coverage and debate around the world about income inequality suggests that this is a norm that continues to evolve.
What Others Have Said On This Topic
Significantly, as far as I have been able to determine the two most active groups that measure and study happiness -- the World Value Survey and the World Happiness Report -- make no claims of a relationship between their happiness data and income inequality. The World Happiness Report is quite concerned about inequality (the word is used 117 times in Chapter 2 of the report) and social support, but it turns its focus to the GINI coefficient of the responses to the happiness question rather than the GINI coefficient of income. The discussion in Chapter 2 seems to acknowledge that direct evidence of a relationship between income inequality and self-reported happiness is hard to find. The weakness of the relationship (often inverse) has been reported before (see also here, here and here). Others have also noted cultural differences in views of income inequality.
Nevertheless one can find studies that claim there is a relationship between income inequality and happiness (see here, here, here and here). In general one will see that these referenced papers only study one country, or one subset of the population, and/or make their claim on the basis of relatively complex multi-variable equations in which income inequality survives as one statistically significant variable among a large set of statistically significant variables. As reflected in the figures above, if there is a relationship, it is not a simple and compelling one.
Transparency and reproducibility: All of the labeled Figures can be generated by my code using the free, publicly available R program to analyze the free publicly available data available from the links in the article.


Comments