Significant Variation In Future Income And Upward Mobility By College

Part II of a two part series on college education. Part I discussed long term trends in average income outcomes. Part II focuses on significant differences in college outcomes related to income and upward mobility.
Summary:- Future salary outcomes of those who go to college vary significantly by college. Nevertheless, college students with parents in the bottom income quintile successfully improve their own relative income rank.
- The average salary of students when they reach their 30’s is highly correlated -- in decreasing order of impact -- with: the average parental income of their classmates, the average salary of their college professors, their SAT score, and which majors students chose.
- Broadly speaking, college students’ future salary is a result of the interaction between the college’s social network, the college’s teaching skill, student aptitude and career choice.
- The value of a college’s social network can be inferred by analyzing college success rates in raising poor college students to the top 1% of income.
Data
The data used here was made publicly available by Chetty, Friedman, Saez, Turner, and Yagan and was used in their 2017 paper: “Mobility Report Cards: The Role of Colleges in Intergenerational Mobility” featured on the Equality of Opportunity website. Their paper is well worth reading. The income of college students who attended college from 1999 - 2004 was measured in 2014 when they were 32-34 years. I used a subset of their data, restricting the colleges looked at to those who had more than 150 students in birth years 1980-84 (that is roughly equivalent to restricting my analysis to only those colleges with 150 students per graduating class).
Widely Varying Income Outcomes
Figure 1 shows the distribution of median alumni income by college. While education clearly has an income benefit, that benefit depends a great deal on which college students attend. Median income by college of 32-34 year olds in 2014 ranged from $10,300 to $112,700.
Figure 1: Average Income Distribution By College

The weighted median (weighted by number of students) of colleges’ median alumni incomes was $40,400 (this figure is based on wage income only). For comparison using a different source of income data -- the 2014 ACS Census Data -- 32 to 34 year old individuals born in the US with at least 2 years of college had median wage income of $42,000, compared to a median income of $18,000 for those with less than 2 years of college.[1]
More Uniform Success Improving Intergenerational Mobility
College students of parents in the bottom income quintile are more uniformly successful in raising their own relative income rank. Approximately 38% of children with bottom income quintile parents went to college. Of those that went to college, 15.9% were in the top income quintile in their early 30s compared to 4.1% of those that did not go to college. Ninety seven percent of colleges had upper quintile placement higher than 4.1% and 85% of colleges had upper quintile placement rates higher than two times the 4.1% non-college level.
Similarly, about 16% of college educated children with bottom income quintile parents stayed in the bottom income quintile in their early 30s. That compares to approximately 44% of non-college educated children with bottom quintile income parents. Ninety percent of colleges at least doubled the chance children of bottom income quintile parents would get out of the bottom income quintile compared to those that did not go to college with parents in the bottom income quintile.[2]
The Chetty et. al. data set cannot tell us how great a role the colleges actually played in improving poor students outcomes relative to the students' own aptitude and drive. To start answering that question, we would need data by individual that included measures like SAT scores and subsequent income for those that went to college and those that didn't. I suspect many of those that don't go to college also don't take an SAT exam, and that the set of high SAT scorers that don't go to college is small.
Why Do Income Outcomes Vary So Much?
There are a number of factors considered individually which seem to explain these widely different outcomes. For example the SAT scores of admitted students on its own explains 60% of the differences in mean income per college. The mix of graduating students by major by itself explains 48% of the differences. The average parental income by college explains 55% of the differences (not an individual child’s parents’ income, but the average parental income of all of a student’s classmates). Finally, average faculty salary explains 46% of the differences. Clearly many of these factors are highly correlated with each other.
If we combine these factors into one linear model, 79% of the variability in average incomes by college is accounted for. Figure 2 shows the difference between actual incomes and those predicted by the model.
Figure 2: Average Income Distribution By College

Table 1 shows the statistically significant factors and the 10th, 90th and 50th percentile values for the 709 colleges the predictive model is based on. Most of the factors are intuitively straightforward. SAT is a measure of student aptitude and prior training. Faculty salary is presumably correlated with professors’ skill. Percent STEM and Business majors relate to professions which are often relatively highly paid.
Table 1: Distribution Of Predictive Variables
| Percentile | SAT Avg. 2001 | % STEM | % Business | % Health | Avg. All Parents Income | Avg. Faculty Salary |
| 10% | 940 | 4.8 | 0.0 | 0.0 | $83,343 | $43,481 |
| 90% | 1,270 | 31.1 | 35.1 | 16.5 | $277,518 | $73,981 |
| 50% | 1,075 | 14.5 | 19.9 | 3.3 | $125,428 | $54,200 |
To get a sense of each factor’s importance, we can look at the model’s income payoffs if a college were to move from the 50th percentile to the 90th percentile for each variable. Table 2 shows the increase in mean income expected by the predictive model if a college moved from a 50th percentile value to a 90th percentile value for each factor separately. For the same percentile move, average parental income has the largest payoff, followed by faculty salary, SAT, percent STEM majors, and then other Major choices.
Table 2: Payoffs in Average Alumni Income Based On Factors Correlated With Income Results By College
| Correlated Factor | Avg. College Income Increase Moving From 50th to 90th Percentile |
| SAT Avg. 2001 | $7,903 |
| % STEM | $5,070 |
| % Business | $3,444 |
| % Health | $3,915 |
| Avg. All Parents Income | $12,065 |
| Avg. Faculty Salary | $11,627 |
It is not immediately intuitive why the average income of all the parents of students enrolled in a college should matter beyond what is already captured by faculty salary and average student SAT scores. To gain more insight, we can look at how successful colleges seem to be at providing upward mobility for students of poor parents.
College Success Rates In Providing Upward Mobility
The paper by Chetty, Friedman, Saez, Turner, and Yagan cited above looks at several measures of upward mobility. One measure is how many students from a college make it into the top 1% of income despite the fact that their parents were in the bottom quintile of income. I will use the term "Upward Success Rate" to refer to the percentage of students that achieve a high relative income (e.g., top quintile, top 1% etc.) even though their parents were in the bottom income quintile.[3]
Figure 3: Distribution of Top 1% Income Upward Success Rate From Bottom Quintile Parents By College

Figure 3 shows the distribution of the success rates by college in raising students of bottom income quintile parents to the top 1% of income. This distribution is highly skewed. While the weighted median success rate by college is 0.4%, the weighted mean success rate of 1.0% is 3.2 times greater than the median. Seventy five percent of all colleges have a success rate lower than 0.7%. Yet 27 colleges shown in Table 3 have success rates that are at or above 10% -- 30 to 90 times higher than the median success rate.
Table 3: Colleges With 10% or Better "Upward Success Rates" To Top 1% of Income

Table 3: Colleges With 10% or Better "Upward Success Rates" To Top 1% of Income
The factors that are statistically significant in explaining 53% of the differences in top 1% college success rates are shown in the “payoff” table, Table 4. A college’s biggest gains in top 1% upward success rates are correlated in decreasing order of importance with: percentage of parents in the top 1% of income, average faculty salary, average SAT score, and percent of STEM majors.
Table 4: Payoffs Of Factors Correlated With Differences Between College Success Rates of Students With Bottom Income Quintile Parents Reaching The Top 1% of Income
Predictive Factor
|
1% Upward Sucess Rate Improvement College Moving From 50th to 90th Percentile
|
SAT Avg. 2001
|
0.94%
|
% STEM
|
0.38%
|
% Parents In Top 1%
|
1.91%
|
Avg. Faculty Salary
|
1.08%
|
The importance of parental income is born out by the 27 colleges listed in Table 3. The weighted mean for the percent of students with parents in the top 10% of income for these 27 colleges is 54%. That compares to 16% for all colleges in this data set.
The percent of parents in the top 1% of income is capturing something separately from student aptitude, a college’s teaching skill, and career choice. While the nature of this data set cannot isolate the reason the percentage of wealthy parents plays a role (because the data is not at the student level, it is at the college level), a plausible hypothesis is that poor students gain increased access to the social network of the wealthy when they go to colleges with a high percentage of students with wealthy parents.
If access to the social network of the wealthy plays a role, one might expect 1) the percent of top income decile parents should matter more for top 1% upward success rates than it matters for top quintile upward success rates (because the top quintile social network is more accessible as it is 20 times larger than the top 1% social network) and 2) students from wealthy households should have a greater probability of being in the top 1% than poor students because wealthy students generally have greater access to the wealthy's social network.
Figure 4 shows the relationship between top 1% upward success rates versus the percentage of students with parents in the top income decile. It appears that the success rate accelerates as the percentage of well off students at a college exceeds approximately 33%.
Figure 4 shows the relationship between top 1% upward success rates versus the percentage of students with parents in the top income decile. It appears that the success rate accelerates as the percentage of well off students at a college exceeds approximately 33%.
Figure 4: Students Achieving Top 1% of Income With Bottom Quintile Parents vs. Percent of Parents In Top Decile Of Income

Figure 5: Students Achieving Top Quintile of Income With Bottom Quintile Parents vs. Percent of Parents In Top Decile Of Income

Figure 6: Students Achieving Top 1% of Income With Bottom Quintile Parents vs. Those With Parents In Top Quintile
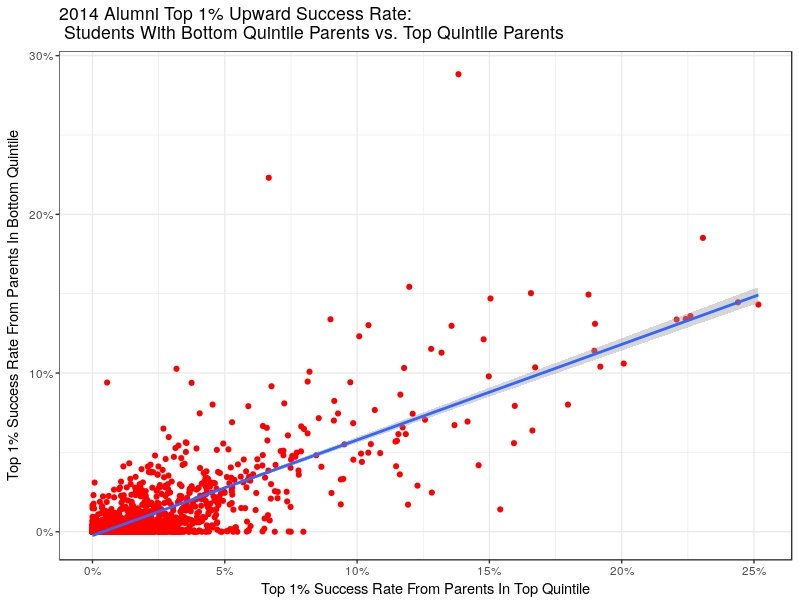
However the two success rates are correlated, so poor students who study and socialize with wealthy students also appear to benefit (in addition to the success they achieve by being bright, going to well taught classes, and making monetarily rewarding career choices).
This "social network" hypothesis would also help explain why average parents’ income is also significant in explaining differences in future average student income by college as shown in Table 2.
Is Income Variation Just A Grad School Phenomenon?
The data used in this essay does not distinguish between those college students who go on and get a graduate degree and those that don't. Using US Census data, Figure 7 shows the percentage of income ventiles (formed from 32-34 year olds born in the US with positive wage income) represented by those with at least a college degree and Figure 8 shows the share graduate degrees represent of those with at least a college degree.
Figure 7: Percent of 32-34 Year Olds With At Least College Degree By Income Ventile In 2014

Figure 8: Percent Of College Educated 32-34 Year Olds With A Graduate Degree By Income Ventile In 2014

The two charts show that more than 80% of the 32-34 year olds in the top 5% of income had at least a college degree, and that more than 50% of that college educated 80% also had graduate degrees. Given the importance of graduate degrees in upper income percentiles, one might ask if differences in college alumni income and upward success rates could be explained if some undergraduate colleges generate a disproportionate percentage of students who go on to get graduate degrees.
If we separately link data from the NSF on PhDs by their baccalaureate institution to the Chetty, Friedman, Saez, Turner, and Yagan data set, we can look at the relationship between college average income and upward success rates by the percentage of undergraduates who go on to get PhDs.[4] We would prefer to have data on all graduate degrees, not just PhDs. However it is interesting to analyze the PhD data that is available.
Figure 9: 2014 Average Salary of 32-34 Year Olds By College vs. Percent of Class That Typically Goes On To Get A PhD

Figure 10: 2014 1% Upward Success Rates From Bottom Income Quintile Parents vs. Percent of Class That Typically Goes On To Get A PhD

Conclusion
Paradoxically, colleges provide both an important step in the path of upward income mobility and strongly reinforce existing social networks of unequal income.
We saw in Part I that simply having a Bachelor's degree provides less income advantage than it did in the 1960s as the supply of college educated labor increased. However, being at the bottom of the income distribution is also increasingly highly correlated with not having a 4 year college degree. In Part I, I talked about wages being related to supply, demand and skill pay-offs that may be increasing due to technology.
We saw in Part II that income outcomes vary greatly depending on which college one attends. The most exclusive schools with the greatest access to wealthy social networks are not surprisingly dominated by children of wealthy parents and admit relatively few students from poor backgrounds. However, income payoffs are highest for those poor (and highly qualified) students that are admitted to those elite schools (which also have highly skilled professors).
Thus Part II raised the question whether income payoffs may also have a social network component in addition the income attributable to educational attainment. It is an open question whether those high payoffs for poor students would remain if elite institutions no longer maintained their wealthy student demographic.

[1] Data available from IPUMS-USA, University of Minnesota, www.ipums.org. It is freely available subject to their licensing agreement.
[2] The figures in the paragraph and the following paragraph are estimated from the data set, Table 1 of the Chetty, Friedman, Saez, Turner, and Yagan paper and Table VI of "Where is the Land of Opportunity?The Geography of Intergenerational Mobility in the United States" by Chetty, Hendren, Kline, and Saez. The estimates are only approximate due to small differences in the data sets.
[3] This is distinct from the "Mobility" term that Chetty, Friedman, Saez, Turner, and Yagan use which multiply success rate and access. Access is a college's share of students with bottom quintile parents.
[4] I averaged the number of PhDs who came from each college in the years 1999-2004 and divided by cohort size to obtain a "typical percent" of PhDs per college.
Transparent and reproducible: All Figures and Tables can be generated by using the free, publicly-available R program and the R code available in “college.r" on github to analyze the publicly available data obtainable from the links in the article.


Comments