Religious Diversity In America

Part I Summary:
- Religious denominations are highly differentiated along dimensions of income, education, race, regional concentration, social views, and attitudes towards science and reason.
- American’s self-described belief in God or a universal spirit declined from 2007 to 2014 based on Pew Research data. Faith also became increasingly evenly dispersed across approximately 367 different denominations.
American Religious Diversity
When the Pew Research Center asked 35,000 Americans in 2014 to describe their faith, they gave 370 unique answers. Three of those answers included "Atheist", "Agnostic" and "Nothing in particular."
American religious diversity was noted as long ago as 1831 by Alexander Tocqueville: "Protestants of all communions, Anglicans, Lutherans, Calvinists, Presbyterians, Anabaptists, Quakers, and a hundred other Christian sects, there's the basis of the population." In fact American religious diversity grew significantly just from the 1600's to the American Revolution:
"For much of the 17th century, 90 percent of American congregations are Anglican or Congregational, but by the time of the Revolution, that percentage has shrunk to 35 percent. Anglican congregations are outnumbered by Scotch-Irish Presbyterians, and their numbers are matched by English and Welsh Baptists. Quakers, German Lutherans and German Reformed congregations are also on the rise."Religious diversity continued to grow in the 1800s due to the creation of new sects and immigration. In economic terms, the increasing number of distinct denominations is an indication that denomination "start up costs" are minimal, and there are few economies of scale.
If there were significant economies of scale, one would expect that denominations holding only fractional market shares would merge. But mergers appear to relatively rare.
A denomination's largest expenses are real estate and "labor" costs. These are difficult costs to spread over multiple locations. There is some evidence that megachurches (those churches with membership greater than 2,000) do benefit from scale as multi-site megachurches are seeing stronger growth. Notably, some megachurches spread their labor cost by video-streaming preaching from a central location to their satellite locations.
For most denominations, however, the scarcity of mergers may also be attributable to dis-economies of scale. For example, merging could cause membership loss associated with losing historical heritage, a lessening of shared social interests, and/or having to harmonize different theological perspectives. Indeed the significant demographic differences between denominations suggests that being able to successfully target a specific market segment is an important driver of a denomination's American market share.
Education, Income, Age and Race
Table 1 compares the educational, income, age and racial composition of the top 25 most common responses regarding a respondent's "denomination."
Table 1: 2014 Pew Research Center Religious Landscape Study Demographics
| Denomination | 2014 Share | Bachelors Deg | Post Grad Deg | Income > $100,000 | Age 25-39 | Age 65+ | White | Black | Hispanic | Other |
| ALL RESPONDENTS | 100.0% | 15% | 12% | 16% | 23% | 17% | 65% | 11% | 15% | 9% |
| Catholic | 20.8% | 15% | 11% | 16% | 19% | 20% | 58% | 3% | 33% | 6% |
| Nothing in particular | 15.8% | 14% | 10% | 15% | 32% | 9% | 63% | 12% | 15% | 11% |
| Southern Baptist Convention | 5.3% | 12% | 7% | 14% | 15% | 27% | 84% | 6% | 3% | 6% |
| Agnostic | 4.0% | 23% | 19% | 27% | 36% | 9% | 78% | 3% | 8% | 10% |
| United Methodist Church | 3.6% | 20% | 17% | 23% | 14% | 32% | 94% | 1% | 2% | 3% |
| Atheist | 3.1% | 24% | 18% | 28% | 33% | 9% | 78% | 3% | 10% | 10% |
| Independent Baptist in the Evangelical Protestant tradition | 2.5% | 11% | 6% | 11% | 18% | 18% | 87% | 0% | 6% | 7% |
| Nondenominational evangelical | 2.0% | 20% | 14% | 19% | 28% | 10% | 73% | 7% | 12% | 7% |
| Protestant non-specific / Other Protestant in the Mainline Protestant tradition | 1.9% | 12% | 10% | 13% | 24% | 16% | 71% | 0% | 15% | 13% |
| Church of Jesus Christ of Latter Day Saints | 1.6% | 22% | 12% | 18% | 27% | 15% | 84% | 1% | 8% | 7% |
| American Baptist Churches in the USA | 1.5% | 7% | 6% | 8% | 17% | 19% | 73% | 10% | 11% | 7% |
| Church of Christ | 1.5% | 10% | 8% | 14% | 23% | 21% | 68% | 16% | 10% | 5% |
| Protestant non-specific in the Evangelical Protestant Tradition | 1.5% | 10% | 8% | 11% | 24% | 14% | 63% | 0% | 27% | 10% |
| National Baptist Convention | 1.4% | 11% | 8% | 8% | 11% | 23% | 0% | 99% | 1% | 0% |
| Assemblies of God | 1.4% | 10% | 5% | 8% | 19% | 23% | 66% | 3% | 25% | 6% |
| Evangelical Lutheran Church in America (ELCA) | 1.4% | 19% | 17% | 23% | 12% | 31% | 94% | 2% | 1% | 3% |
| Baptist not further specified (just a Baptist) in the historically black Protestant tradition | 1.2% | 6% | 4% | 6% | 23% | 13% | 0% | 98% | 2% | 0% |
| Lutheran Church, Missouri Synod | 1.1% | 18% | 14% | 19% | 12% | 30% | 94% | 2% | 1% | 3% |
| Nondenominational not further specified (just Nondenominational) in the Evangelical Protestant tradition | 1.0% | 20% | 7% | 14% | 30% | 7% | 72% | 0% | 12% | 16% |
| Episcopal Church in the USA | 0.9% | 26% | 29% | 31% | 13% | 34% | 90% | 4% | 2% | 4% |
| Presbyterian Church USA | 0.9% | 22% | 25% | 28% | 9% | 37% | 87% | 5% | 4% | 4% |
| Reform Jewish | 0.8% | 30% | 34% | 42% | 17% | 29% | 92% | 0% | 4% | 4% |
| Jehovah's Witness | 0.8% | 8% | 4% | 4% | 22% | 22% | 35% | 26% | 31% | 7% |
| Pentecostal not further specified (just a Pentecostal) in the Evangelical Protestant tradition | 0.7% | 4% | 2% | 6% | 25% | 13% | 59% | 0% | 29% | 12% |
| Don't know/refused - no information on religious identity | 0.6% | 12% | 18% | 12% | 31% | 11% | 56% | 4% | 8% | 32% |
The range between the lowest value and the highest value in each column shows strong differences in demographic makeup.
The first column of Table 2 suggests some denominations have historically been more successful in attracting immigrants than others. The next two columns of Table 2 highlighted in green show the percentage of US born respondents that were born into their current denomination versus the percentage that converted to their current denomination.
Composition By Foreign Born, Convert, Fertility And Region
Other than through merger, a denomination can gain market share through immigration, converting US-born residents or through disproportionate birth rates (if children maintain the faith of their parents).
The first column of Table 2 suggests some denominations have historically been more successful in attracting immigrants than others. The next two columns of Table 2 highlighted in green show the percentage of US born respondents that were born into their current denomination versus the percentage that converted to their current denomination.
The total percentage of converts is shown as well as the percentage of converts that were formerly Catholic. As Catholics have the largest existing market share, they also often make up the largest percentage of converts. If each denomination sourced Catholic converts equally, they would all be expected to have the same 24% of converts coming from Catholics (the average for all denominations), but success in attracting Catholics varies by denomination.
Table 2: 2014 Pew Research Center Religious Landscape Study - Additional Demographics
| Denomination | Non US | US: Not Convert | US: Convert | Total Convert | % of Converts: From Catholic | Attend Month+ And 3+ Kids | Mixed Marriage As % Marr/Liv. Togthr | Northeast | South | Midwest | West |
| ALL RESPONDENTS | 15% | 37% | 48% | 55% | 24% | 11% | 43% | 18% | 37% | 21% | 23% |
| Catholic | 28% | 64% | 8% | 10% | 0% | 15% | 25% | 26% | 27% | 21% | 26% |
| Nothing in particular | 14% | 19% | 67% | 78% | 35% | 2% | 51% | 19% | 33% | 21% | 27% |
| Southern Baptist Convention | 2% | 64% | 34% | 35% | 14% | 12% | 22% | 2% | 80% | 11% | 7% |
| Agnostic | 8% | 3% | 90% | 97% | 30% | 0% | 68% | 21% | 29% | 19% | 31% |
| United Methodist Church | 4% | 52% | 44% | 47% | 18% | 12% | 36% | 16% | 47% | 27% | 9% |
| Atheist | 13% | 4% | 83% | 94% | 31% | 0% | 67% | 24% | 26% | 20% | 30% |
| Independent Baptist in the Evangelical Protestant tradition | 5% | 40% | 56% | 60% | 16% | 14% | 41% | 12% | 54% | 19% | 15% |
| Nondenominational evangelical | 8% | 11% | 80% | 88% | 21% | 15% | 33% | 9% | 35% | 25% | 30% |
| Protestant non-specific / Other Protestant in the Mainline Protestant tradition | 14% | 16% | 70% | 82% | 26% | 3% | 81% | 21% | 28% | 22% | 29% |
| Church of Jesus Christ of Latter Day Saints | 7% | 67% | 26% | 31% | 28% | 28% | 17% | 5% | 20% | 7% | 67% |
| American Baptist Churches in the USA | 9% | 41% | 50% | 58% | 21% | 17% | 53% | 16% | 43% | 24% | 16% |
| Church of Christ | 6% | 47% | 46% | 51% | 15% | 17% | 41% | 5% | 49% | 26% | 20% |
| Protestant non-specific in the Evangelical Protestant Tradition | 18% | 14% | 68% | 83% | 33% | 13% | 58% | 12% | 32% | 22% | 34% |
| National Baptist Convention | 4% | 68% | 28% | 30% | 14% | 19% | 40% | 10% | 67% | 19% | 4% |
| Assemblies of God | 21% | 29% | 50% | 64% | 31% | 21% | 28% | 14% | 37% | 24% | 25% |
| Evangelical Lutheran Church in America (ELCA) | 4% | 59% | 37% | 40% | 19% | 14% | 35% | 16% | 17% | 54% | 13% |
| Baptist not further specified (just a Baptist) in the historically black Protestant tradition | 4% | 54% | 42% | 45% | 10% | 14% | 63% | 12% | 65% | 18% | 5% |
| Lutheran Church, Missouri Synod | 3% | 62% | 35% | 37% | 17% | 11% | 38% | 7% | 16% | 61% | 17% |
| Nondenominational not further specified (just Nondenominational) in the Evangelical Protestant tradition | 6% | 9% | 85% | 91% | 22% | 16% | 57% | 7% | 40% | 24% | 28% |
| Episcopal Church in the USA | 6% | 51% | 43% | 48% | 29% | 10% | 53% | 26% | 40% | 14% | 21% |
| Presbyterian Church USA | 9% | 44% | 47% | 54% | 12% | 17% | 37% | 17% | 38% | 24% | 21% |
| Reform Jewish | 8% | 54% | 38% | 43% | 5% | 4% | 52% | 38% | 28% | 14% | 19% |
| Jehovah's Witness | 26% | 28% | 46% | 65% | 34% | 22% | 36% | 18% | 36% | 17% | 29% |
| Pentecostal not further specified (just a Pentecostal) in the Evangelical Protestant tradition | 22% | 25% | 54% | 71% | 26% | 18% | 61% | 15% | 48% | 17% | 20% |
| Don't know/refused - no information on religious identity | 16% | 14% | 70% | 79% | 23% | 2% | 63% | 20% | 29% | 21% | 31% |
Fertility is indicated by the column showing the percentage of respondents who have 3 children or more and attend service at least monthly. The focus on "regular attenders" is important because Pew's research indicates that children of parents for whom religion is unimportant also tend to be less religious.
Also shown to the right are the percentage of all respondents in mixed marriages as a percentage of respondents currently married or living with a partner. Pew's research indicates that children of mixed marriages are less likely to be religious. Their data suggests it is not necessarily mixed marriage itself that causes lower religious attachment, it is that religion tends to be less important for parents who enter into mixed marriages. That is, the parents' disinterest is the cause of the diminished religiousness of their children --- not the form of the marriage.
The four columns of Table 2 highlighted in yellow show the strong geographical variations by denomination.
Social Views, Science/Reason, And Conviction
Denominations also differ sharply as to the social views of their members. For background to see this, it is important to understand factors that are highly correlated to social views.
Figure 1 shows that Pew's 2014 data documents that American support for gay marriage and abortion are both strongly correlated with education.
Figure 1 shows that Pew's 2014 data documents that American support for gay marriage and abortion are both strongly correlated with education.
Figure 1: 2014 Pew Research Center Religious Landscape Study - Social Questions

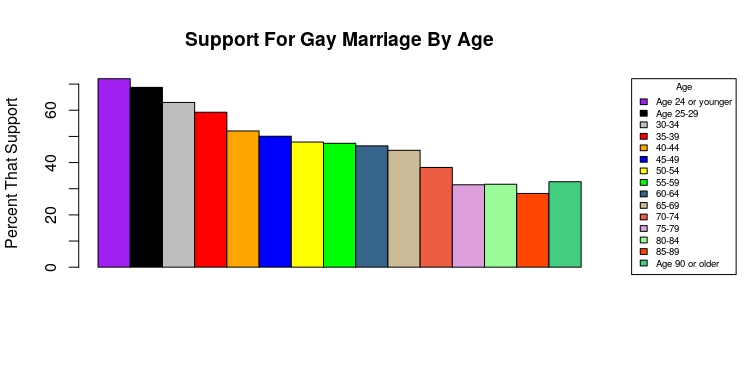
Figure 2 shows that American support for gay marriage in 2014 was also highly correlated with age.
Figure 2: 2014 Pew Research Center Religious Landscape Study - Support For Gay Marriage By Age
Knowing these relationships, we can look at these issues by denomination after controlling for education and age[1]. The first three columns of Table 3 document wide denominational variations on both social issues. In general support for gay marriage between the young compared to all College+ (college degree as well as those with postgraduate degrees) respondents is similar within each denomination. However, there are cases where support is higher among the young than among College+ respondents of all ages (e.g., Church of Jesus Christ of Latter Day Saints and Southern Baptist Convention)
Table 3: 2014 Pew Research Center Religious Landscape Study Social & Faith Perspectives
| Denomination | College+: Support Abortion | College+: Support Gay Marriage | Age25-39: Support Gay Marriage | Ethics: Based on Science or Reason | Believe, But Not Absolutely Certain | Religion Very Import | Attend Monthly+ |
| ALL RESPONDENTS | 63% | 65% | 64% | 20% | 26% | 53% | 50% |
| Catholic | 53% | 65% | 66% | 20% | 33% | 58% | 57% |
| Nothing in particular | 82% | 85% | 76% | 28% | 39% | 17% | 11% |
| Southern Baptist Convention | 27% | 21% | 33% | 6% | 10% | 81% | 72% |
| Agnostic | 91% | 95% | 94% | 44% | 38% | 4% | 4% |
| United Methodist Church | 65% | 60% | 60% | 14% | 28% | 61% | 63% |
| Atheist | 93% | 95% | 96% | 53% | 5% | 2% | 2% |
| Independent Baptist in the Evangelical Protestant tradition | 29% | 32% | 46% | 7% | 13% | 74% | 66% |
| Nondenominational evangelical | 24% | 27% | 28% | 7% | 8% | 85% | 84% |
| Protestant non-specific / Other Protestant in the Mainline Protestant tradition | 66% | 62% | 68% | 18% | 35% | 41% | 27% |
| Church of Jesus Christ of Latter Day Saints | 24% | 20% | 35% | 8% | 12% | 84% | 86% |
| American Baptist Churches in the USA | 62% | 51% | 48% | 12% | 17% | 73% | 61% |
| Church of Christ | 39% | 27% | 34% | 9% | 17% | 73% | 68% |
| Protestant non-specific in the Evangelical Protestant Tradition | 46% | 39% | 43% | 10% | 13% | 79% | 67% |
| National Baptist Convention | 71% | 39% | 50% | 9% | 9% | 91% | 84% |
| Assemblies of God | 16% | 16% | 39% | 4% | 10% | 86% | 81% |
| Evangelical Lutheran Church in America (ELCA) | 73% | 80% | 86% | 14% | 31% | 58% | 60% |
| Baptist not further specified (just a Baptist) in the historically black Protestant tradition | 78% | 66% | 63% | 11% | 13% | 81% | 61% |
| Lutheran Church, Missouri Synod | 43% | 50% | 61% | 13% | 20% | 65% | 67% |
| Nondenominational not further specified (just Nondenominational) in the Evangelical Protestant tradition | 35% | 35% | 42% | 6% | 8% | 77% | 77% |
| Episcopal Church in the USA | 83% | 83% | 88% | 24% | 38% | 49% | 53% |
| Presbyterian Church USA | 70% | 67% | 71% | 18% | 31% | 64% | 70% |
| Reform Jewish | 94% | 92% | 98% | 36% | 51% | 20% | 24% |
| Jehovah's Witness | 25% | 24% | 20% | 4% | 9% | 90% | 88% |
| Pentecostal not further specified (just a Pentecostal) in the Evangelical Protestant tradition | 15% | 29% | 34% | 11% | 15% | 80% | 69% |
| Don't know/refused - no information on religious identity | 79% | 75% | 77% | 30% | 31% | 23% | 21% |
The next column looks at the percentage of respondents who believe that "Science", or "Philosophy and Reason" are are most important when it comes to questions of right or wrong. Also highlighted in blue, the next column shows the percentage who believe in God or a universal spirit, but are not "Absolutely certain."[2] In general there appears to be a correlation between these two characteristics: the more a denomination's members look to science or reason, the less certain their faith is.
The two columns of Table 3 highlighted in green compare the percentage of respondents who say religion is very important in their life and the percentage of respondents who attend service (excluding weddings and funerals) at least monthly by denomination. Again, there is generally a correlation between the two responses. I was fascinated to see that 2% of Atheists say they attend a religious service at least monthly --- that is probably a good reminder that survey data has a margin of error!
2007 - 2014 Share Change
The "Family" category of Table 4 is different than the "Denomination" shown in Tables 1 through 3. Family is used because denomination descriptions were not consistent between Pew's 2007 data and their 2014 data. However Pew did use consistent "Family" aggregations of denominations they believe are substantially similar (although members of the aggregated denominations might not agree!).
With that caveat, Table 4 shows share change on a percentage basis, and on an absolute basis (religions with larger shares, are prone to large absolute share changes).
Two dis-aggregations of absolute share change are shown: one dividing absolute share change by US-born and non-US born, and, another dividing absolute share change into the portion coming from those younger than 30, and those older than 30. Both dis-aggregations sum to the denomination's absolute share change.
Two dis-aggregations of absolute share change are shown: one dividing absolute share change by US-born and non-US born, and, another dividing absolute share change into the portion coming from those younger than 30, and those older than 30. Both dis-aggregations sum to the denomination's absolute share change.
Table 4: 2007 and 2014 Pew Research Center Data On Share Change By Religious "Family"
| FAMILY | 2016 Share | 2007 Share | % Share Change | Absolute Share Change | Non-US Chg | US Change | % Growth From Non-US | Age < 30 Change | All other Age Change | % Growth From Under 30 |
| Catholic | 20.8% | 23.9% | -13% | -3.04% | 0.11% | -3.15% | -0.81% | -2.23% | ||
| Nothing in particular family | 15.8% | 12.1% | 30% | 3.67% | 0.66% | 3.01% | 18% | 1.55% | 2.12% | 42% |
| Baptist Family in the Evangelical Protestant Tradition | 9.2% | 10.8% | -15% | -1.63% | 0.00% | -1.63% | -0.16% | -1.47% | ||
| Nondenominational Family in the Evangelical Protestant Tradition | 4.9% | 3.4% | 43% | 1.46% | 0.09% | 1.37% | 6% | 0.33% | 1.13% | 23% |
| Baptist Family in the Historically Black Protestant Tradition | 4.0% | 4.4% | -9% | -0.39% | 0.06% | -0.44% | -0.21% | -0.17% | ||
| Agnostic family | 4.0% | 2.4% | 64% | 1.54% | 0.07% | 1.48% | 4% | 0.70% | 0.85% | 45% |
| Methodist Family in the Mainline Protestant Tradition | 3.9% | 5.4% | -28% | -1.51% | 0.00% | -1.51% | -0.21% | -1.30% | ||
| Pentecostal Family in the Evangelical Protestant Tradition | 3.6% | 3.4% | 4% | 0.13% | 0.22% | -0.09% | 168% | 0.06% | 0.07% | 49% |
| Atheist family | 3.1% | 1.6% | 98% | 1.52% | 0.22% | 1.30% | 15% | 0.66% | 0.87% | 43% |
| Baptist Family in the Mainline Protestant Tradition | 2.1% | 1.9% | 12% | 0.23% | 0.05% | 0.18% | 20% | 0.13% | 0.10% | 57% |
| Lutheran family in the Mainline Protestant Tradition | 2.1% | 2.8% | -26% | -0.75% | -0.05% | -0.69% | -0.02% | -0.73% | ||
| Protestant other/non-specific Family in the Mainline Protestant Tradition | 1.9% | 2.5% | -22% | -0.55% | 0.09% | -0.63% | 0.02% | -0.56% | ||
| Jewish | 1.9% | 1.7% | 8% | 0.14% | 0.04% | 0.10% | 27% | 0.06% | 0.08% | 43% |
| Restorationist Family in the Evangelical Protestant Tradition | 1.6% | 1.7% | -4% | -0.06% | -0.01% | -0.06% | -0.05% | -0.02% | ||
| Mormon | 1.6% | 1.7% | -3% | -0.04% | 0.01% | -0.06% | -0.05% | 0.01% | ||
| Protestant non-specific Family in the Evangelical Protestant Tradition | 1.5% | 1.9% | -21% | -0.38% | 0.04% | -0.42% | -0.19% | -0.19% | ||
| Lutheran Family in the Evangelical Protestant Tradition | 1.5% | 1.8% | -17% | -0.31% | 0.02% | -0.33% | -0.05% | -0.26% | ||
| Presbyterian Family in the Mainline Protestant Tradition | 1.4% | 1.9% | -26% | -0.48% | 0.04% | -0.52% | -0.05% | -0.43% | ||
| Anglican/Episcopalian Family in the Mainline Protestant Tradition | 1.2% | 1.4% | -14% | -0.21% | -0.03% | -0.18% | -0.03% | -0.18% | ||
| Pentecostal Family in the Historically Black Protestant Tradition | 1.0% | 0.9% | 11% | 0.11% | 0.04% | 0.07% | 33% | -0.04% | 0.15% | -39% |
| Unitarians and other liberal Faiths in "Other Faiths" Tradition | 1.0% | 0.7% | 47% | 0.33% | 0.05% | 0.29% | 14% | 0.16% | 0.18% | 48% |
| Nondenominational Family in the Mainline Protestant Tradition | 1.0% | 0.9% | 15% | 0.14% | 0.04% | 0.10% | 28% | 0.07% | 0.06% | 55% |
| Muslim | 0.9% | 0.4% | 94% | 0.41% | 0.34% | 0.07% | 82% | 0.23% | 0.18% | 57% |
| Jehovah's Witness Family | 0.8% | 0.7% | 14% | 0.10% | 0.09% | 0.01% | 90% | -0.03% | 0.13% | -33% |
| Presbyterian Family in the Evangelical Protestant Tradition | 0.8% | 0.8% | -2% | -0.02% | 0.01% | -0.03% | -0.01% | -0.01% |
Several trends are observable in Table 4:
- "Faith" (including Atheists and Agnostics) became more concentrated from 2007 to 2014. The top 10 "Families" accounted for 71% of all respondents in 2014, up from 69%. The increased concentration is due to the growth of Atheists, Agnostics and "Nothing in Particular" which collectively picked up 6.7% of market share over these 7 years.
- Faith excluding Atheists, Agnostics and "Nothing in Particular" became less concentrated. Excluding those three categories, the top 10 families made up 70% of "believers" in 2014, down from 72% in 2007. This is attributable to share losses in the largest "believing" families (i.e., Catholics and "Baptist Family in the Evangelical Protestant Tradition").
- Non-US born respondents were positive contributors of growth for most faith families. Growth attributable to non-US born respondents was particularly high for the "Pentecostal Family in the Evangelical Protestant Tradition", Muslims and the "Jehovah's Witness Family."
- Most faith families that were able to increase share relied heavily on growth of respondents under 30 years of age. This is to be expected as older respondents are much more likely to be "set" within their chosen belief group. Youth, by definition, will determine the future course of religious activity.
Implications of Religious Diversity
From a theological perspective, it is difficult to rationalize the fact that America's denominations are highly differentiated along dimensions of income, race, education and region. US religious diversity strongly suggests that social networking is an extremely important component of religious affiliation. In other words, denominations often appear to be based on shared social and economic interests.
Social networks form because they have evolutionary benefits:
"Social structure, especially in the form of social networks, affects economic outcomes for three main reasons. First social networks affect the flow and the quality of information. much information is subtle, nuanced and difficult to verify, so actors do not believe impersonal sources and instead rely on people they know. Second, social networks are an important source of reward and punishment, since these are often magnified in their impact when coming from others personally known. Third, trust, by which I mean the confidence that others will do the 'right' thing despite a clear balance of incentives to the contrary, emerges, if it does, in the context of a social network."[3]
Social networks provide affirmation, trusted information, and protection.[4] This observation is not intended to minimize or trivialize religious faith, but only to infer that fractionalized and demographically differentiated denominations appear to co-optimize religious and social objectives.
Part II of this analysis will examine the American decline in faith in God or a universal spirit in greater detail.
Transparent and reproducible: All of the labeled Figures and Tables can be generated by using the free, publicly-available R program and the R code available in “religion.R” on github to analyze the publicly available data obtainable from the links in the article.
[1] Otherwise apparent differences by religion would simply reflect differences in religions' age and educational composition.
[1] Otherwise apparent differences by religion would simply reflect differences in religions' age and educational composition.
[2] Note that the low percentage for Atheists in this column simply means there is a low percentage of Atheists who believe in God or a universal spirit.
[3] Mark Granovetter, "The Impact of Social Structure on Economic Outcomes," Journal of Economic Perspective" 19, no. 1 [2005]: 33-50 -- quoted from footnote 8 on page 204 of Why Information Grows by Cesar Hidalgo, pub. Basic Books, NY, Copyright @2015
[4] This may partly explain the widespread positive net growth in denominations from immigration: social networks are particularly valuable to new arrivals.


Comments